A slow-loading Cocos Creator Web Mobile build creates a poor user experience. Before optimizing it, we first need to understand where the loading time is being spent.
Inspect requests with DevTools
Open browser developer tools with F12 and select the Network tab. It lists every request made by the project, including resource size and duration.
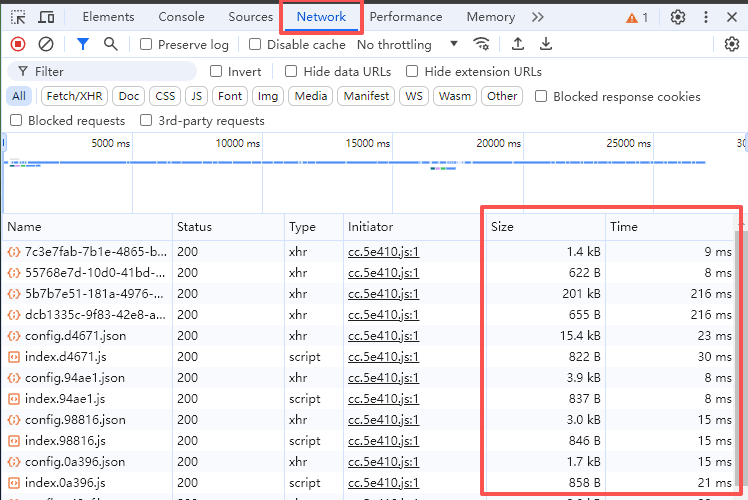
The Network panel shows the overall timing, but it can still be difficult to understand the loading process in detail.
Run an analysis script in the console
The following script categorizes Cocos Creator resources by file size, waiting time, and download time:
1 | (function() { |
The final check reports files smaller than 50 KB that take more than 100 ms. Adjust those thresholds for your project.
To use it:
- Open the deployed Web Mobile project, preferably through a real or local web server.
- Open DevTools → Console.
- Paste the script and press Enter.
- Review the filename, type, size, total time, waiting time, download time, and anomaly list.
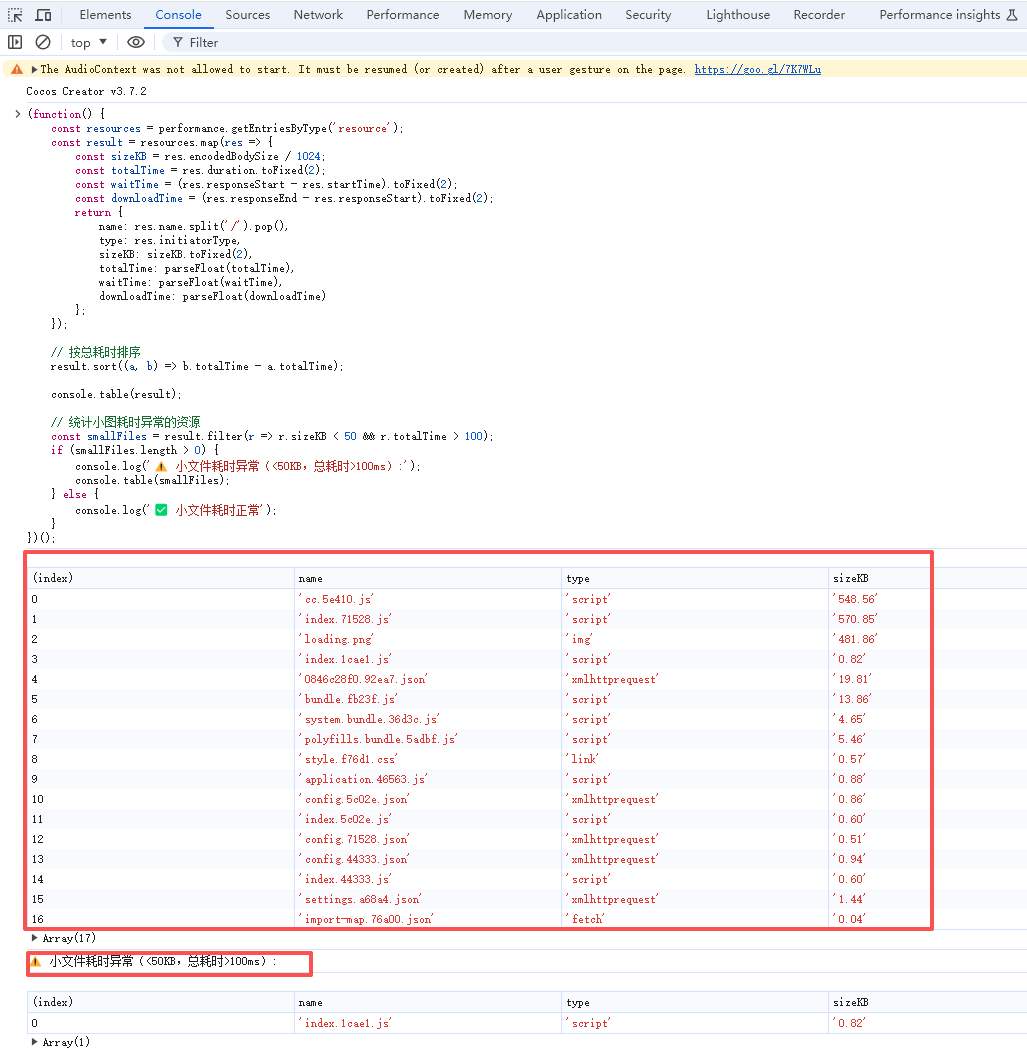
If DevTools warns you not to paste code you have not reviewed, read and verify the script first. Then type allow pasting, press Enter, and paste it again.
| Field | Meaning |
|---|---|
name |
Resource filename |
type |
Resource initiator type |
sizeKB |
Resource size in KB |
totalTime |
Time from request start to completion in milliseconds |
waitTime |
Time before the server starts responding; affected by latency and server response time |
downloadTime |
Actual transfer time; affected by file size and bandwidth |
Interpret the results
- If
waitTimeis much higher thandownloadTime, network latency or server response time is probably the main issue. - If
downloadTimedominates, investigate bandwidth, file size, and server throughput. - Sort by
totalTimeto identify critical first-screen bottlenecks. - If large images load quickly while small images take a long time, possible causes include browser concurrency limits, request latency, missing cache entries, or CDN cache misses.